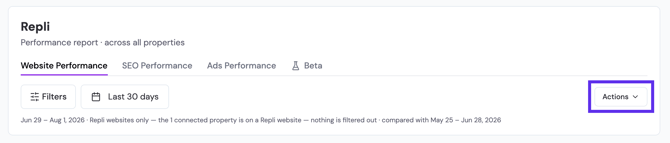
Where to find it.
Select Report from the left navigation. Reporting is available at two levels, controlled by the Workspace selector:
- Company — performance across all properties in a portfolio
- Property — performance for a single property
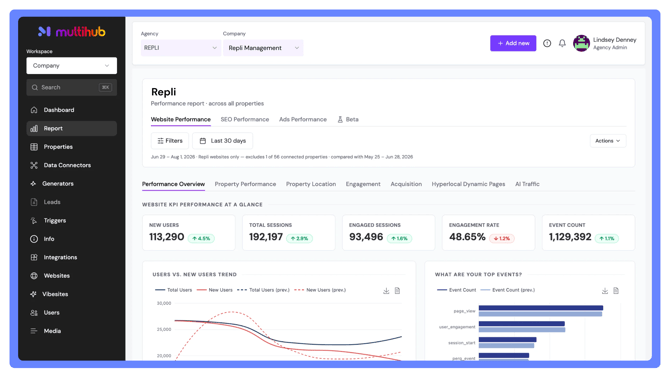
The three report types.
Each report opens with a set of tabs across the top:
|
Tab |
What it covers |
|---|---|
| Website Performance | Traffic, engagement, and on-site behavior |
| SEO Performance | Organic search visibility and performance |
| Ads Performance | Paid campaign performance |
| Beta | Newer reporting features still in testing |
We cover each of these in its own article.
Setting your date range and filters.
- Last 30 days (or whichever range is selected) sets the reporting period. Every report automatically compares against the immediately preceding period of the same length — so a Jun 29 – Aug 1 view compares against May 25 – Jun 28.
- Filters narrow the data within the report and vary by report type.
- The date range and comparison period are always shown beneath the tabs, so you can confirm what you're looking at.
Moving through a report.
Within each report type, a second row of tabs breaks the data into sections of report pages. For example, on Website Performance, those are:
Performance Overview · Property Performance · Property Location · Engagement · Acquisition · Hyperlocal Dynamic Pages · AI Traffic
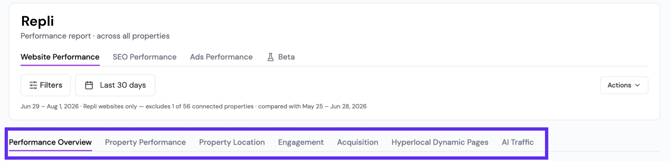
The remaining tabs go deeper into specific areas. The tab list differs between report types.
Exporting your data.
- Individual charts have download and view-data icons in their upper right corner, for pulling a single visualization or its underlying numbers.
- The Actions menu in the upper right handles report-level options to Export PDF.